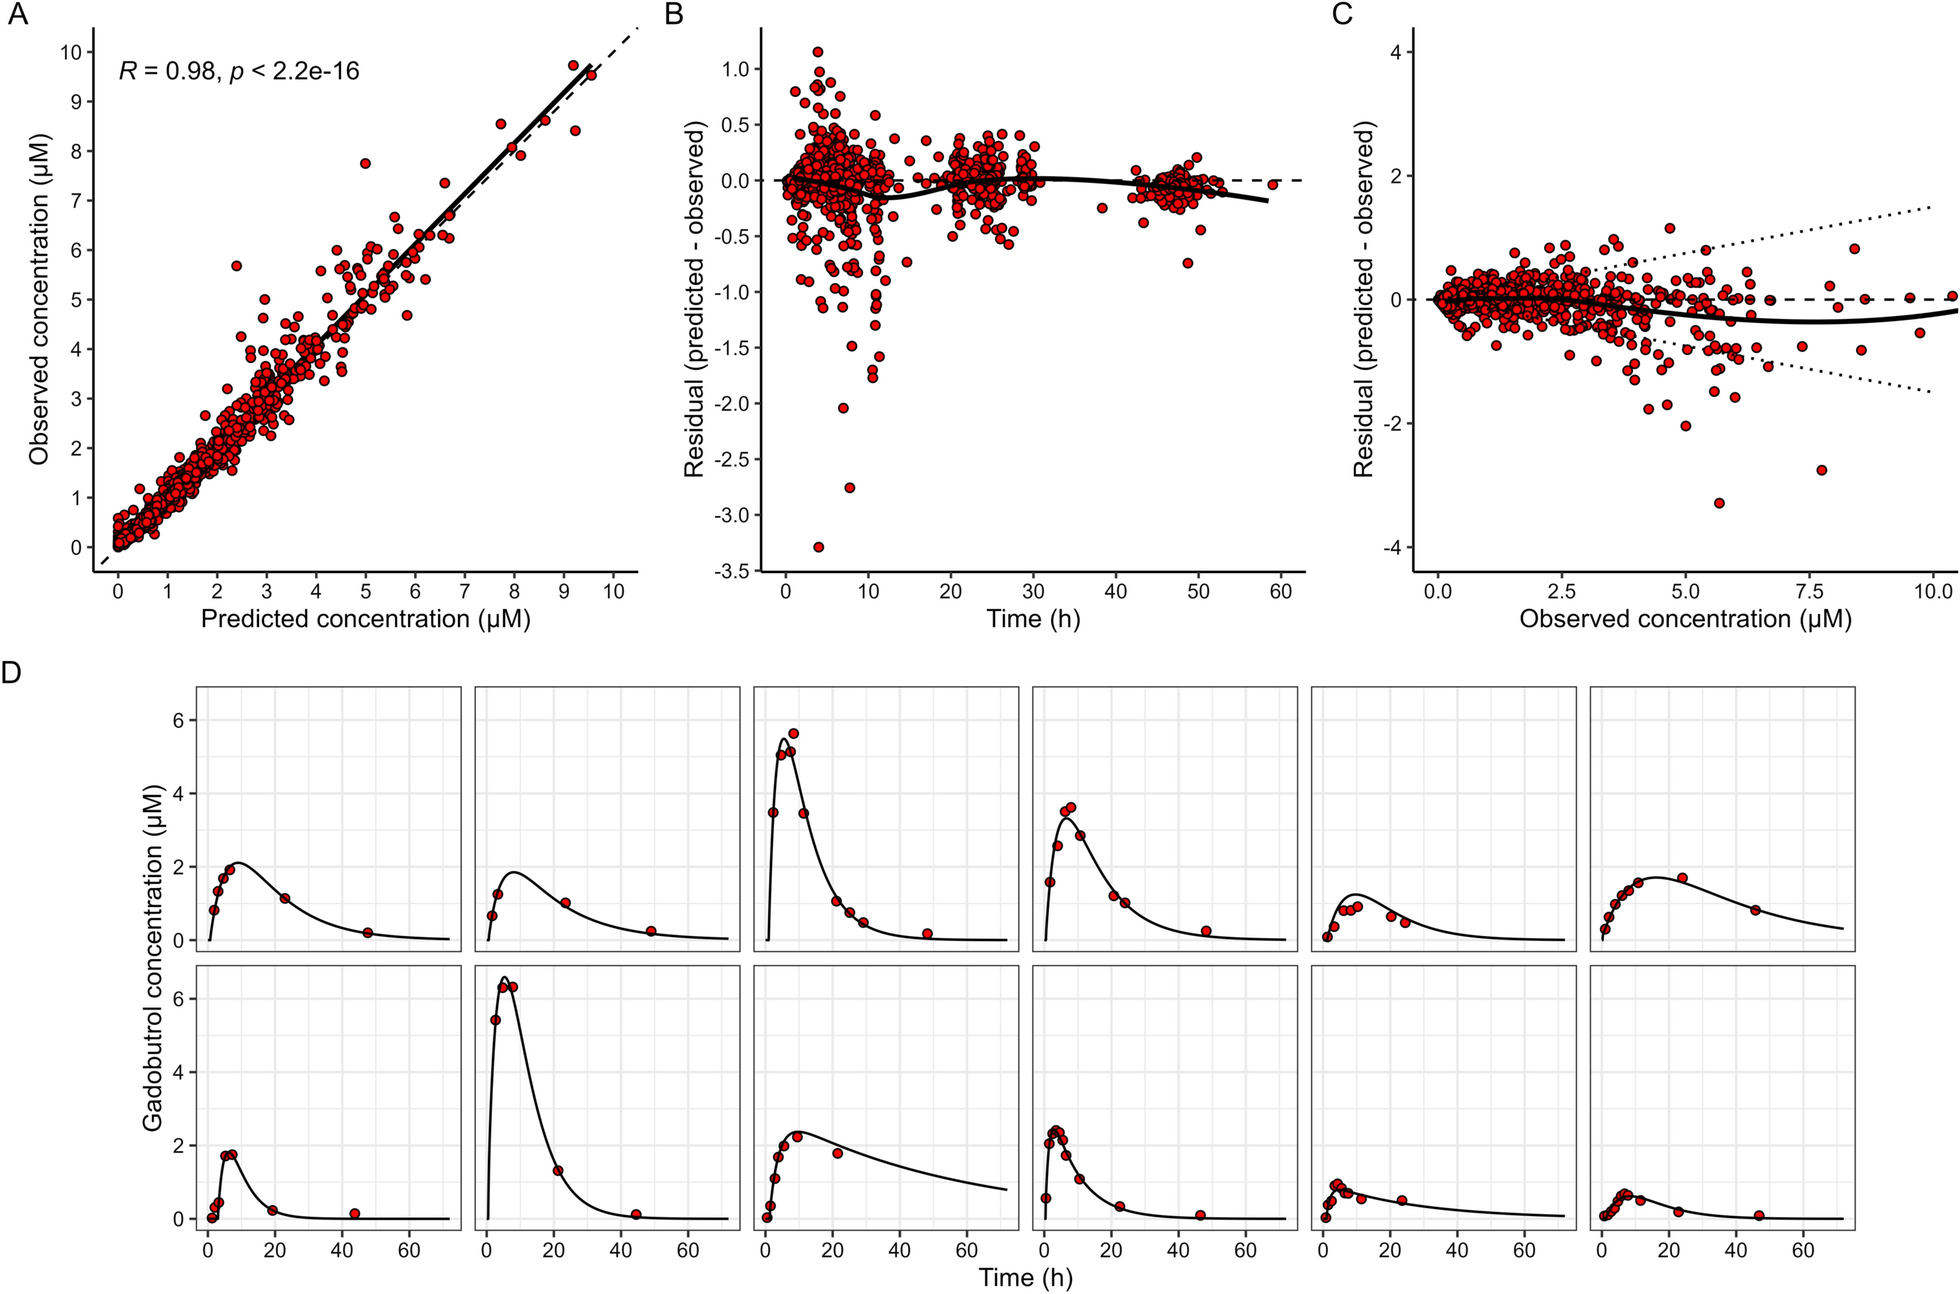
Fig. 2

Population pharmacokinetic model diagnostic plots.AObserved gadobutrol concentrations against posterior individual predicted concentrations. Dashed and solid lines represent the unity and linear regression line, respectively.BResidual error against time, solid line represents the l.CResidual error against individual observed gadobutrol concentrations, dotted lines represent the treshold for 15% relative error.DRandomly selected patient profiles, with observations (dot) and individual predictions (solid line), demonstrating goodness of fit
